
The Bitcoin Realized Market Cap data from Glassnode, shows that the current realized market cap is just 5.4% away from $469 billon dollars which was the realized market cap at all time high.
However, Bitcoin’s price is still 38% away from its all time high of $69,000.
Will Bitcoin’s price catch up soon? Data says yes.
Table of Contents
Realized Market Cap is a net sum of all profits and losses that have been realized by all Bitcoin users since its creation in 2009 to till date. The metric is often used in on-chain analysis to show the net inflow and outflow of money into Bitcoin or other cryptocurrencies.
When will Bitcoin’s Price Catch-up?
As per my own estimates, it could take Bitcoin take the nest 3-4 months to catch up with the price. My belief is based on the following reasons.
- There has been high inflows into Bitcoin ETFs. Even after losing nearly $5 billion, GBTC’s Bitcoin ETF is still at $26 billion, 13x larger than its next competitor, i.e., BlackRock ($2 billion).
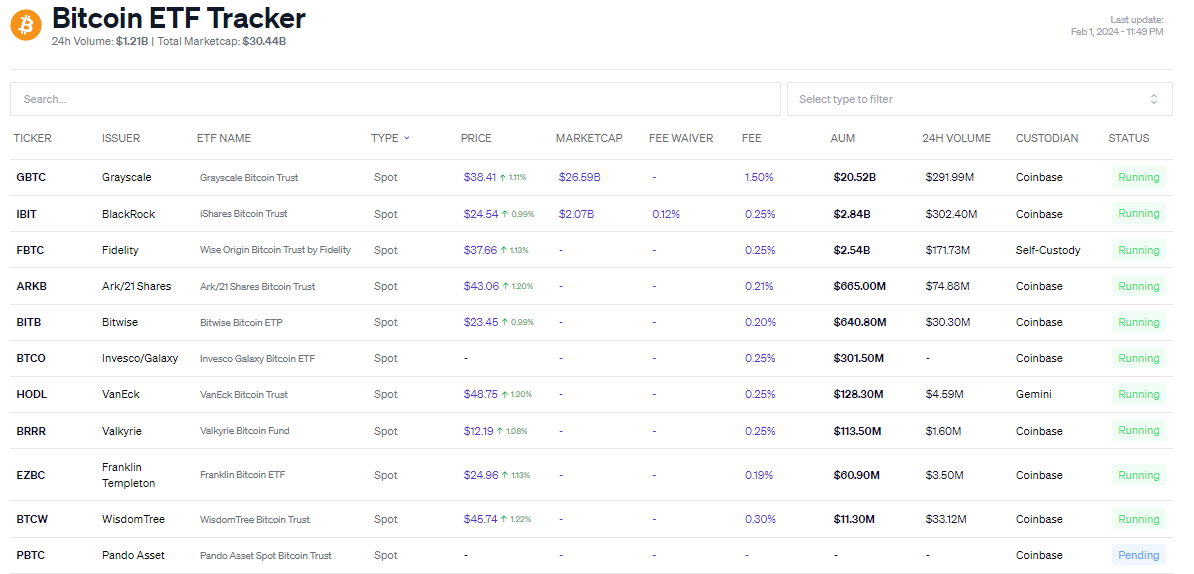
- The net inflows in Bitcoin alone far exceeds the inflow in other cryptocurrencies. You can see how Bitcoin still dominates 51% of the total crypto market cap.
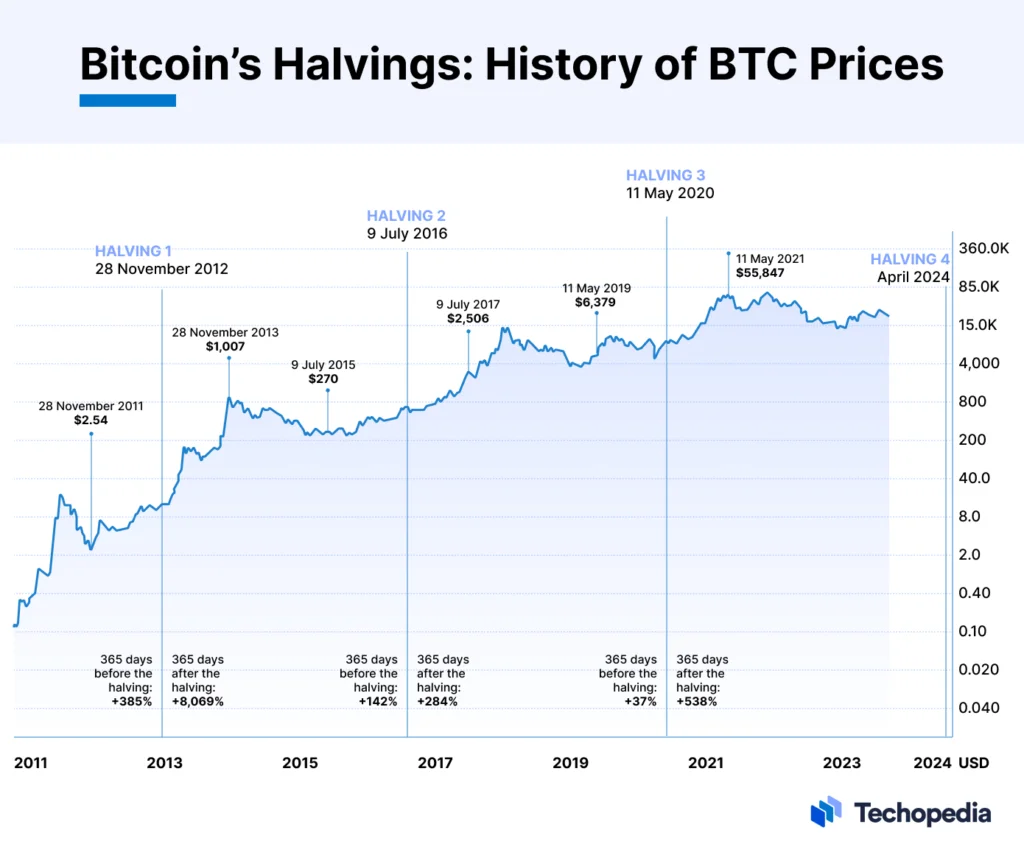
- Finally as the halving approaches, we will experience more volatility in Bitcoin. Also, Bitcoin has always given superior returns post halving. See image below.
Disclaimer: I am myself planning to invest in Bitcoin in Feb 2024.
How to Enter Low and Sell High?
Easy Guide to MACD
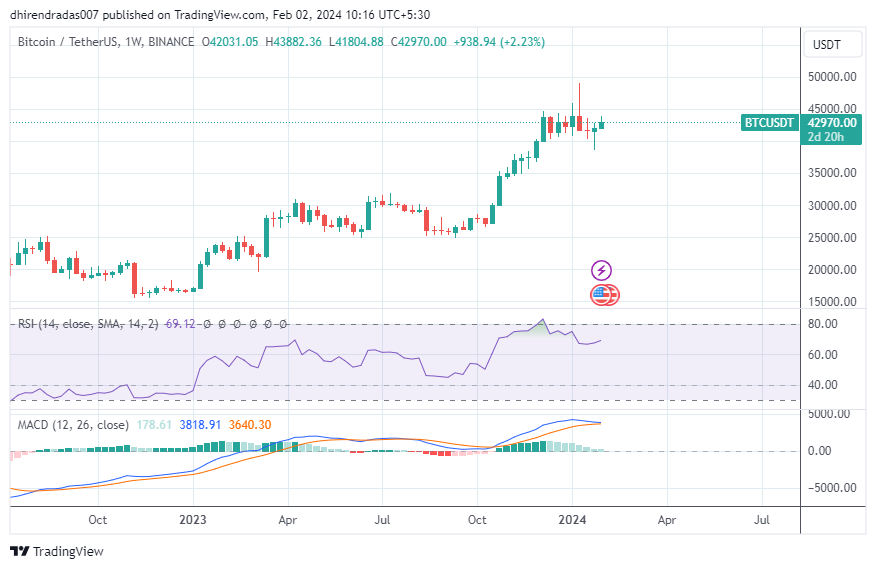
The easiest way is to enter the markets using just the MACD indicator. This indicator shows that when the blue line(MACD Line) climbs above the orange line(Signal Line), the market is in momentum. This occurs because the MACD line indicates short term momentum, and the Signal Line indicates long term momentum.
If the short term momentum is higher than long term momentum, it clearly shows that buyer interest is increasing. Therefore, the price will also increase as more people buy.
Application to Current Markets
In the above chart setup (Weekly Charts), the MACD line is decreasing and might go down below the signal line. This shows that short term momentum is decreasing.
Therefore its best to invest a little later when MACD line is above Signal line.
Even if you are planning to invest now, the best way is to invest in multiple instalments (Dollar Cost Averaging).