The Cup and Handle chart pattern is a technical analysis tool used by traders to identify potential bullish continuation or reversal setups in the price charts of financial assets. It is characterized by its unique shape, resembling a tea cup with a handle, and is considered a signal that an asset’s price is likely to move upwards.
Table of Contents
Characteristics of the Cup and Handle Pattern
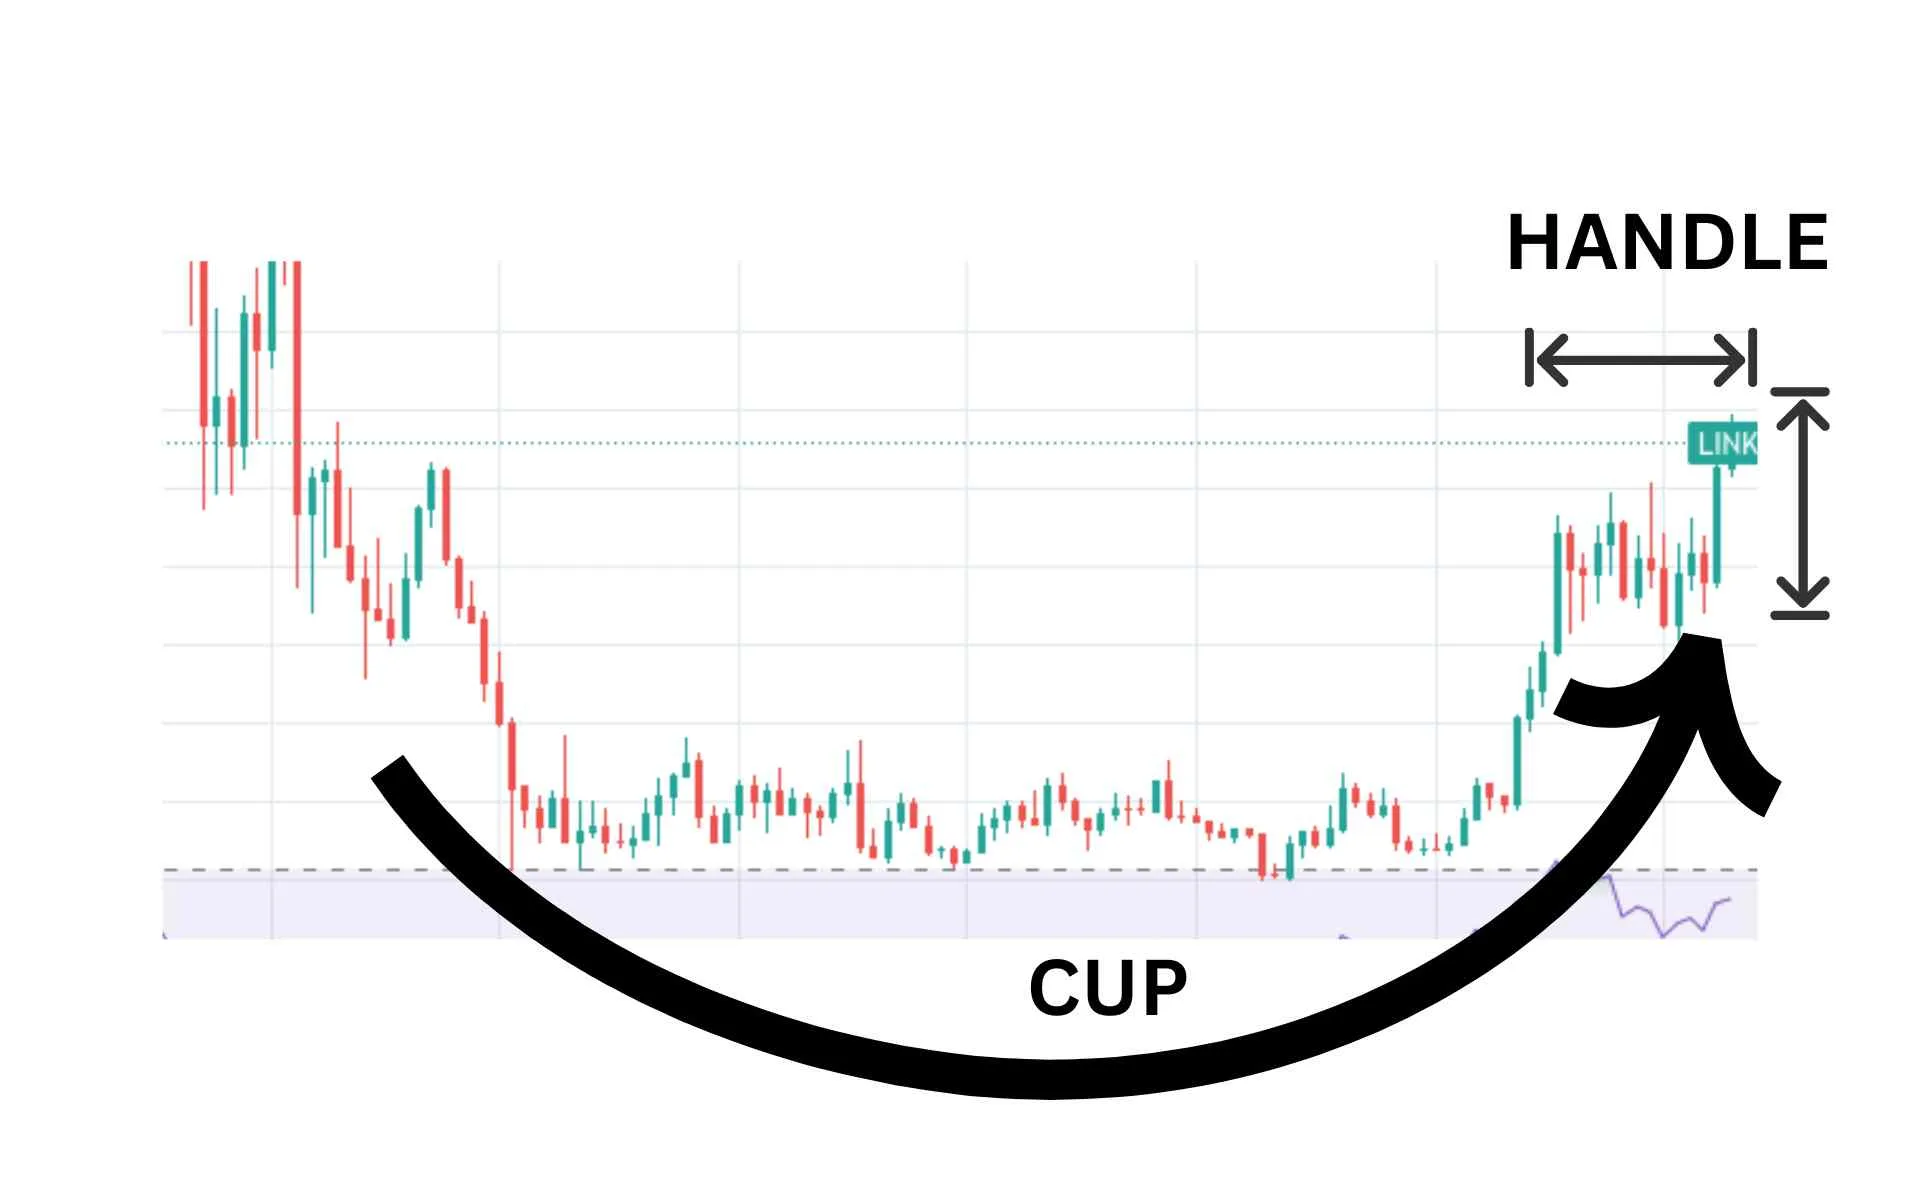
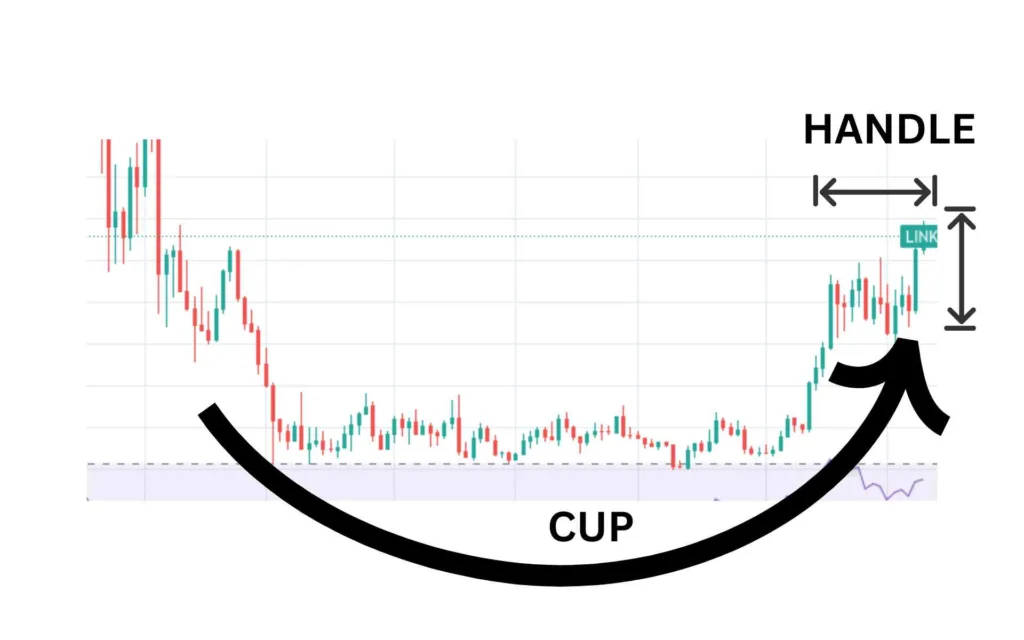
- The Cup: This part of the pattern is a rounded bottom that looks like a bowl or a cup. It forms when the price initially drops and then gradually recovers back to the level where the drop started. The cup should have a smooth, rounded bottom and not be too deep, indicating a consolidation period that can last from several weeks to many months.
- The Handle: After the cup forms, the price might undergo a slight downward drift, forming the handle. This part is smaller and is typically a consolidation phase that occurs on the right side of the cup. The handle should slope downward slightly or move sideways, but not drop significantly into the cup formation.
Interpretation
In my 8 years of trading, I have used the cup and handle to pre-empt the price movements with a fair degree of accuracy.
- Bullish Signal: The Cup and Handle pattern is considered a bullish signal. The idea is that after enduring a period of consolidation (the cup) and a slight pullback (the handle), the asset is gearing up for a breakout to higher prices.
- Entry Point: A common strategy is to wait for the price to break above the resistance level—defined by the peak of the handle—with increased volume. This breakout is seen as an entry point for traders.
Usually in crypto trading, cup and bottom pattern should be used with another confirmation indicator such as RSI above 60 or 70. You can also used MACD or Bollinger bands.
5 Step Trading Strategy for Cup and Handle
- Identification: Look for a cup formation followed by a smaller consolidation period forming the handle. The cup should have a rounded bottom, and the handle should not dip significantly into the cup.
- Volume: Ideally, volume diminishes during the formation of the handle and then increases significantly during the breakout above the handle’s resistance.
- Entry: Traders often enter a position when the price breaks above the handle’s resistance, preferably on higher volume.
- Stop-Loss: To manage risk, a stop-loss order is typically placed below the handle’s lowest point.
- Profit Target: The profit target can be estimated by measuring the depth of the cup and projecting that distance upwards from the breakout point.
The Cup and Handle pattern is popular among traders for its straightforward interpretation and the clear trading signals it can provide. However, like all trading strategies, it’s important to use it in conjunction with other technical indicators and analysis methods to improve accuracy and manage risk.
How to Identify Targets and Stoploss

The targets for cup and handle pattern is estimated from the breakout point which is the point where the handle finishes. At this point, the depth of the cup is added to get the target levels.
For example is the depth of the cup is $50 and the handle finishes forming at $75, then the target of the pattern is $75 + $50 = $125.
Stoploss for this pattern should be placed a little below the breakout point i.e., around $52 in the above example.
Example of Cup and Handle Pattern
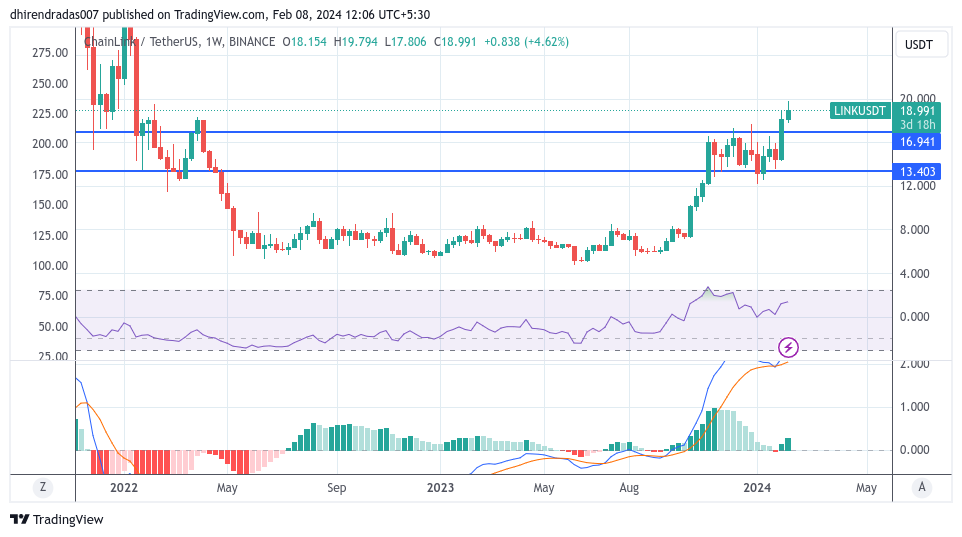
The cup and handle pattern has been forming alongside the rounding bottom. The cup started forming in 4 April 2022 and has finished in 6 November 2023. The handle started forming in the same day as the cup ended and the entire pattern finished forming on 29 Jan 2024.
The target for the cup and handle pattern comes at $26 – $28.